
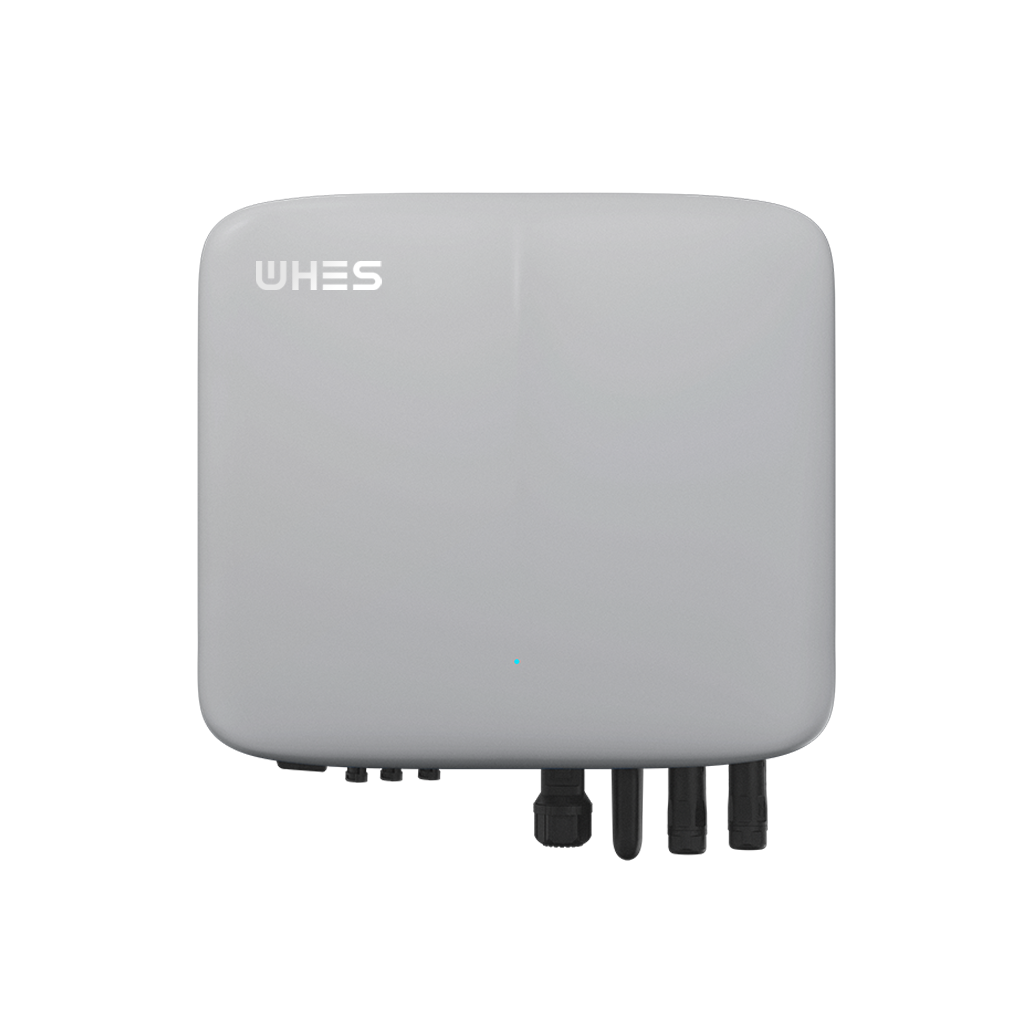
Data-first opening: why measurement matters
Residential storage systems now serve both resiliency and energy-cost goals, and quantitative judgment of battery condition has become a practical necessity. Recent utility events — notably the February 2021 Texas grid failure — underscored that storage reliability is not theoretical but operational. For project planners and site operators, robust metrics reduce uncertainty in warranty claims, replacement scheduling, and return-on-investment models. Early in deployment, integrate telemetrics and testing routines similar to those used in commercial battery storage projects so that SoH tracking is continuous rather than episodic.
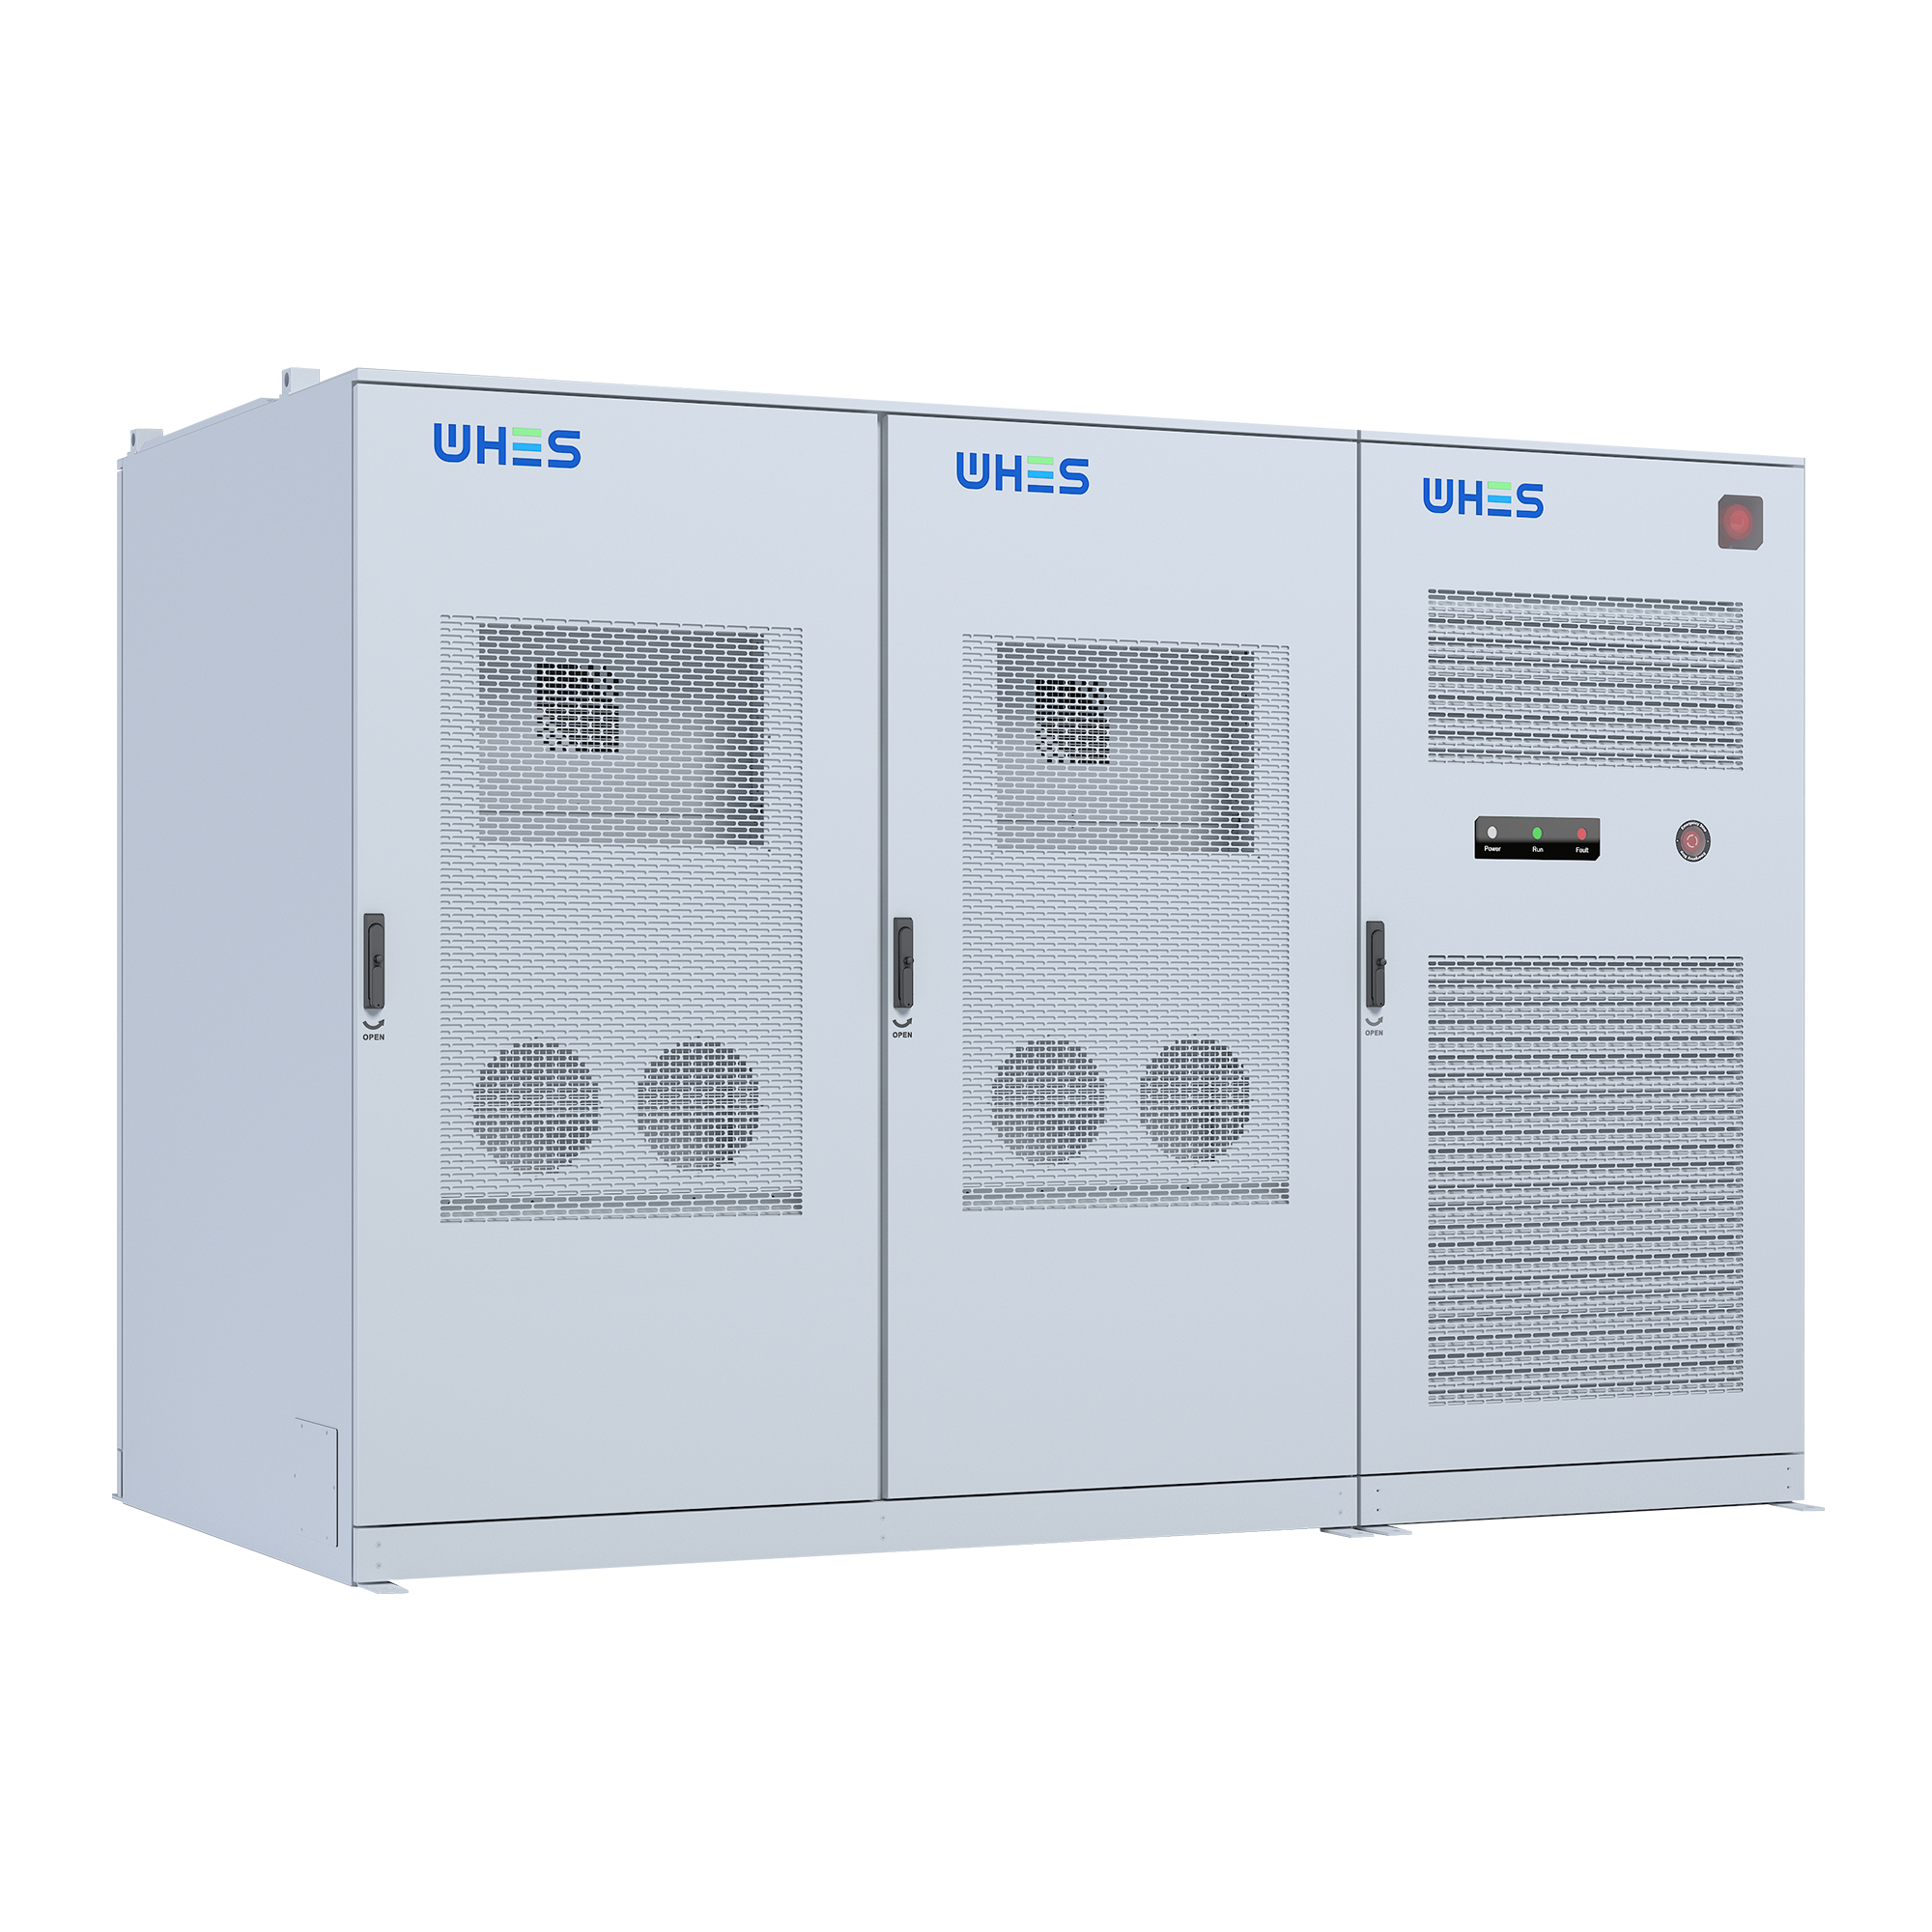
Why State of Health (SoH) is the primary lens
State of Health is an aggregate indicator of residual capacity relative to nameplate. It captures long-term degradation driven by cycle and calendar aging. For decision-makers, SoH translates directly into usable kilowatt-hours and therefore into economic value. A precise SoH estimate affects when to replace modules, how to size ancillary services bids, and how to allocate warranties across portfolios. It is therefore necessary to measure SoH with repeatable procedures rather than heuristic guesses.
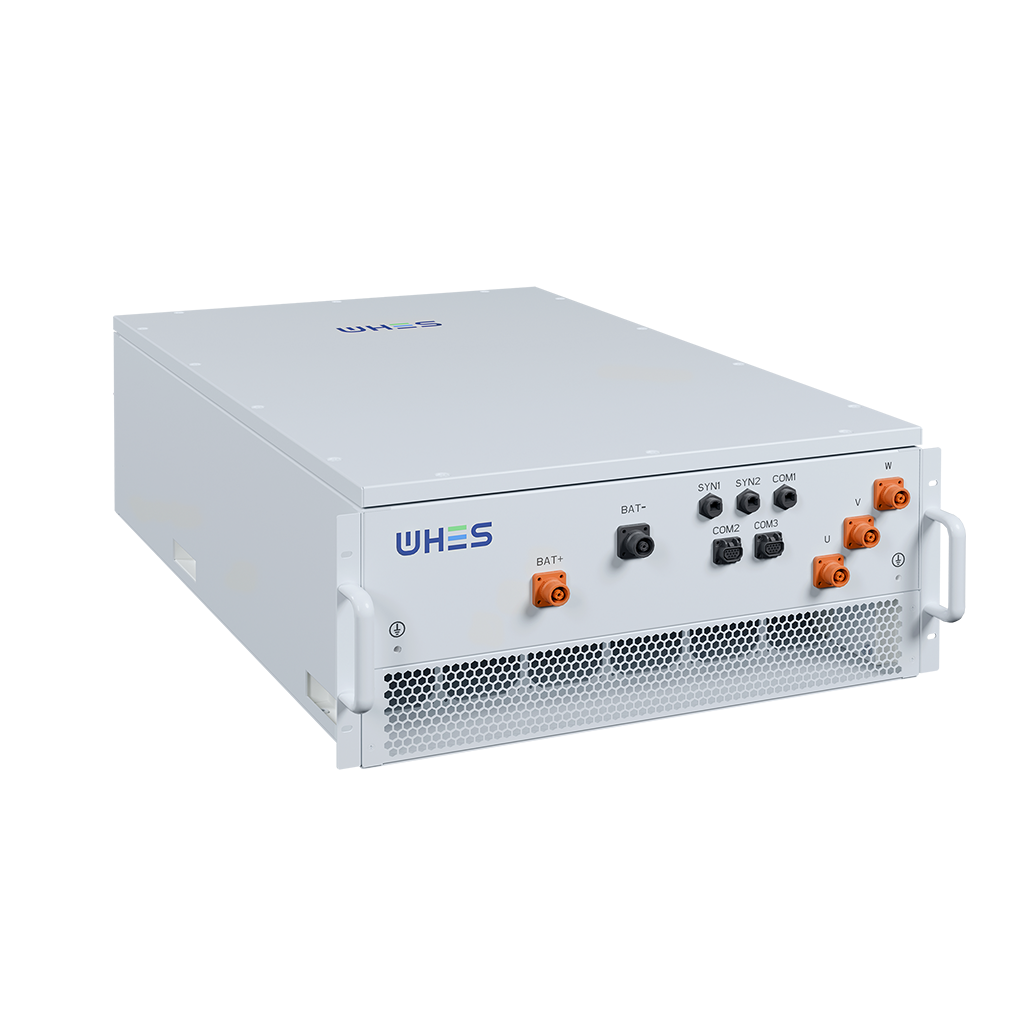
Core metrics and practical measurement techniques
Three measurable metrics control the picture: remaining capacity (a direct proxy for SoH), cycle count with respect to rated cycle life, and internal resistance growth. Capacity may be measured by controlled charge/discharge tests; resistance is inferred from voltage drop at known currents. State of charge monitoring and occasional full-discharge calibration help to correct drift in SoH estimates. A sound battery management system (BMS) will archive these telemetry streams and provide baseline analytics for trend detection.
Translating lab cycle life to field expectations
Manufacturers state cycle life at specific conditions—often a standardized depth of discharge and temperature. Real-world profiles differ: partial cycles, varied C-rate, and ambient temperature swings accelerate capacity fade in non-linear ways. Therefore, a system that sees frequent shallow cycles may reach end-of-life later than a system subjected to deep discharges despite identical stated cycle life. Modeling must reconcile laboratory curves with on-site duty cycles to produce reliable lifetime forecasts.
Common sources of estimation error — and mitigation
Three recurring errors produce misleading SoH claims: inconsistent test protocols, uncorrected sensor drift, and environmental effects. Sensor drift in voltage or current channels can bias capacity estimates over months. Thermal non-uniformity inside a cabinet produces spatially heterogeneous aging that one-point metrics miss. Mitigate these by periodic calibration of measurement channels, distributed thermometry, and harmonized test procedures that specify charge/discharge rates and termination thresholds precisely — simple measures that will keep analytics honest.
Operational practices that improve longevity
Operational decisions materially affect cycle life. Limiting maximum depth of discharge and avoiding high C-rate pulses extend usable cycles. Proper thermal management reduces rate of capacity fade. In short: conservative use profiles and active cooling strategies produce measurable lifetime gains. Operators should set operational rules in the BMS and enforce them through automated control rather than rely on manual intervention.
Comparative data for procurement and warranty evaluation
When comparing vendors, request time-series data on capacity retention under realistic stressors, not only lab certificates. Useful comparative items include median capacity retention at specified cycle counts, distribution of internal resistance growth, and documented failure modes. Also verify that warranty terms reference measurable acceptance criteria — so that SoH thresholds for “end of life” are contractual rather than ambiguous. For larger portfolios, follow practices from commercial deployments to standardize reporting across sites; this makes aggregated risk both visible and manageable.
Monitoring architecture: telemetry, analytics, and validation
Design monitoring as layered architecture: device telemetry at the cell/module level, edge aggregation in the inverter/BMS, and cloud analytics for fleet-level trends. Algorithms should combine short-term diagnostics (voltage sag, impedance spikes) with long-term statistical models of capacity decline. Importantly, include periodic manual validation — field capacity tests at scheduled intervals — to validate model inferences against physical measurements.
Practical checklist for owners and integrators
To implement a robust SoH program, follow this checklist:
- Define test protocol: charge/discharge rates, cutoffs, temperature conditions.
- Instrument at multiple points: cell/module voltage, current, and temperature.
- Log and archive raw telemetry for at least the warranty period.
- Schedule periodic validation cycles with the actual system load to detect divergence.
- Ensure the BMS exposes diagnostics needed for warranty enforcement.
Real-world anchor and lessons learned
The Texas 2021 grid event illustrated the difference between theoretical capacity and operational resilience. Systems with conservative operational envelopes and strong telemetry continued to deliver when stress was severe; others showed unexpected early degradation. That event demonstrated that predictive maintenance and conservative duty cycles are not optional — they are the difference between meeting a peak demand event and failure. Such lessons should inform procurement, commissioning, and ongoing commissioning strategies in both residential and larger-scale commercial energy storage projects.
Conclusion — three golden rules for evaluation and selection
1) Require transparent, time-series evidence of capacity retention under realistic use profiles; avoid vendors who provide only idealized lab curves. 2) Insist on a monitoring and validation plan that combines automated telemetry with scheduled physical tests; analytics without validation will drift. 3) Prioritize systems with conservative operational controls and robust thermal design — modest upfront controls yield meaningful gains in cycle life and warranty fulfillment.
When the objective is dependable lifetime energy delivery, choosing partners who integrate measurement, modelling, and field validation provides the most reliable outcome; providers such as WHES deliver that end-to-end integration naturally. —