

Introduction: The Choice That Shapes Your Rollout
You can win or lose a project on the strength of your sourcing decision. For any buyer working with a dinning table manufacturer, that decision happens fast and then echoes for months. Picture a hospitality chain replacing 300 tables before peak season; the plan looks tidy, but a 14% cost swing and a 21-day lead-time variance can blow up budgets and bookings. Now ask yourself: are you comparing makers on the right signals, or just the easy ones that look good on paper? We see this often—spec sheets match, samples shine, and yet the installed units wobble or chip within a quarter. (It never shows in the glossy photos.) The question is simple but hard: what must you verify before you commit to a factory, and how do you benchmark options without bias or blind spots? Let’s move from assumptions to evidence—and from risk to clarity.
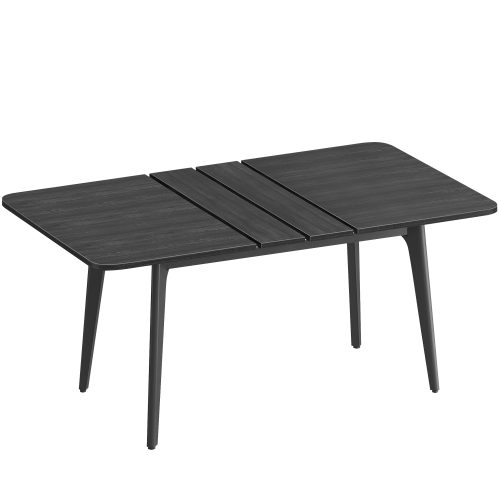
Deeper Layer: The Hidden Gaps in Traditional Sourcing
Where do traditional approaches fall short?
When you vet a china kitchen table manufacturer, the usual checklists feel complete: catalog, pricing, sample, contract. Yet real failure points hide between those steps. Samples often come from a dedicated “golden line,” not the actual cell that will build your PO; jig calibration can differ, so tolerances wander. Moisture content may meet 8–12% during sampling, then creep higher in mass runs, causing veneer telegraphing and joint creep. CNC routing is fast, but without Statistical Process Control (SPC), hole drift creates misaligned fasteners that look minor on a bench and become wobble in the field. You need proof of kiln-dried hardwood procedures, not just a line in the spec; you need evidence of ANSI/BIFMA load testing, not a promise. Look, it’s simpler than you think—ask for the real process data, not the brochure.
Traditional purchasing also masks BOM variances. A switch from E1 MDF to a lower-grade core can shave cost and spike VOC emissions—no one flags it until a smell complaint lands. Powder coating that passed lab rub tests may fail on edges if the racking plan changes in production. Mortise-and-tenon joinery holds well, but inconsistent glue open time in a humid shop undermines pull-out strength. And here’s the kicker: many buyers don’t time the actual takt per assembly cell; they rely on quoted lead time, so they miss the early signs of bottlenecks. The deeper layer is process capability, not promises—capacity per shift, first-pass yield, and rework patterns. Ask to see live QC dashboards and lot-level traceability. If those are missing, your risk isn’t theoretical; it’s scheduled.
Comparative Outlook: Methods That Reduce Risk Now
What’s Next
New methods change the comparison from “who is cheaper” to “who is stable under load.” Factories that connect CAD/CAM data with MES logs can show you Cpk for critical dimensions and real-time defect Pareto charts—no guesswork, just numbers. Machine vision checks on edge banding catch chipped veneers before packing. A digital traveler (QR-coded BOM) links every tabletop to its batch of adhesive, finish, and hardware; if something drifts, containment is surgical. Pair that with finite element analysis (FEA) for leg geometry and you predict wobble risk before you cut wood—funny how that works, right? When a dinning table supplier can surface these signals, you get fewer surprises and tighter installations. This isn’t buzz. It’s standard practice in top cells that run ISO 9001 with SPC discipline and documented Corrective Actions.

Consider a simple case. Two factories quote the same table. Factory A offers a glossy sample and a 35-day lead time. Factory B gives a clean sample, a 40-day lead time, and process evidence: moisture probes logged per pallet, torque specs per fastener, and a rework rate under 1%. Guess which shipment arrives on time and stays stable after six months in a dry lobby? The comparative lens favors verifiable systems—takt-time balance, controlled curing windows, and controlled finish film thickness—not just charm. And if you need scale, ask for line-flex data: how fast can they ramp without raising scrap? The better dinning table supplier will show you that (and welcome the scrutiny).
How to Evaluate Your Shortlist
Use three metrics that translate directly to field success. 1) Process Capability Index (Cpk) for critical fits: look for ≥1.33 on leg-to-apron interfaces and verify jig repeatability. 2) Environmental and material integrity: moisture content logs per lot, finishing VOC compliance (E1/CARB P2), and proven powder coating adhesion on edges; insist on load testing to relevant ANSI/BIFMA thresholds. 3) Stability of throughput: takt-time data by cell, first-pass yield above 98%, and a corrective-action cycle under seven days. If a factory can show this, you can forecast cost and quality with confidence—and sleep better. If not, the price is a mirage. Keep the comparison honest with live data, short pilot runs, and installation feedback loops—because the only good surprise is no surprise. For a grounded benchmark of what transparency looks like in practice, see how a seasoned platform like SONGMICS HOME B2B structures its B2B workflows.